December 7, 2017
Jess and I met after class today to start discussing our map. Originally, we planned to create a map of these best restaurants in the WPI area, along with how expensive they are. However, after receiving an email from Jennifer further discussing this project, we decided that this map would be too simple. To gather some inspirations, we googled some maps.
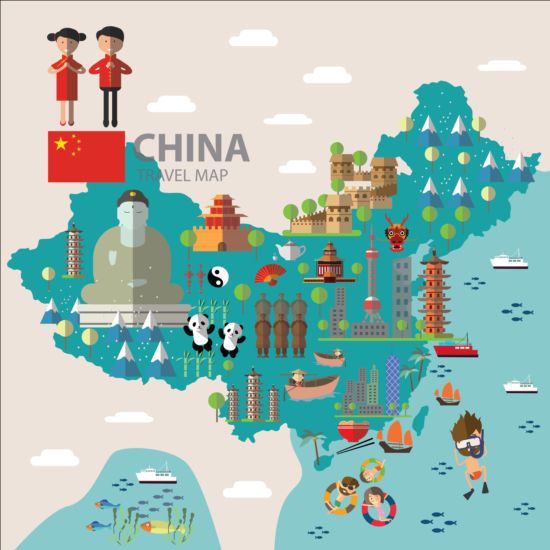
Source: http://freedesignfile.com/238434-china-map-with-infographic-vector-02/
I really liked how this map focused solely on China. The map doesn't have any words, aside from the title. Through icons, it shows the popular tourist/travel places in China. I liked how simple this map was, but that anyone who looked at the map understood it.

Source: https://www.pinterest.com/pin/438115869981095946/
I really liked the key of this map. The varying shades of green on the plant icons easily showed how green different countries across the globe were. I also liked how this map marked the different locations using the location pin from GPS softwares, but changed its color.

Source: https://www.pinterest.com/pin/38421403052308980/
Similar to the China map, this map of Germany also uses icons to show major travel destinations, but it also shows a road that connects each stop, which I really liked.

Source: https://www.pinterest.com/pin/461830136770467053/
This map shows the most known businesses that come out of each state across the US. I really liked the use of logos in this map, and although it has a title, it effectively gets its message across.
Final Idea:
After looking at some example maps, we came up with a final idea, which was a variation of our initial popular food spots.
Ideas of places to eat:
-Altea's Eatery (0.9 miles, 6 minutes by bike) $$$
-Pickle Barrel Deli (0.7 miles, 4 minutes by bike) $$
-Elm Park Cafe (0.4 miles, 3 minutes by bike) $$
-Garden Fresh Courthouse Cafe (0.8 miles, 5 minutes by bike) $$
-Lucky's Cafe (0.7 miles, 5 minutes by bike) $$
-Bean Counter (0.4 miles, 2 minutes by bike)$$
-Bagel Time (0.3 miles, 2 minutes by bike)$
-Dunkin Donuts (1 minute by bike)$
-Daka (30 seconds by bike)$$$
-Library Cafe (1 minute by bike)$
Jess and I met after class today to start discussing our map. Originally, we planned to create a map of these best restaurants in the WPI area, along with how expensive they are. However, after receiving an email from Jennifer further discussing this project, we decided that this map would be too simple. To gather some inspirations, we googled some maps.
Source: http://freedesignfile.com/238434-china-map-with-infographic-vector-02/
I really liked how this map focused solely on China. The map doesn't have any words, aside from the title. Through icons, it shows the popular tourist/travel places in China. I liked how simple this map was, but that anyone who looked at the map understood it.
Source: https://www.pinterest.com/pin/438115869981095946/
I really liked the key of this map. The varying shades of green on the plant icons easily showed how green different countries across the globe were. I also liked how this map marked the different locations using the location pin from GPS softwares, but changed its color.
Source: https://www.pinterest.com/pin/38421403052308980/
Similar to the China map, this map of Germany also uses icons to show major travel destinations, but it also shows a road that connects each stop, which I really liked.
Source: https://www.pinterest.com/pin/461830136770467053/
This map shows the most known businesses that come out of each state across the US. I really liked the use of logos in this map, and although it has a title, it effectively gets its message across.
Final Idea:
After looking at some example maps, we came up with a final idea, which was a variation of our initial popular food spots.
- Food places within biking distance from WPI (no more than a mile away)
- WPI bike share program (Gompei's Gear) makes biking to different places very accessible
- Map of Worcester area, bold the bike paths
Ideas of places to eat:
-Altea's Eatery (0.9 miles, 6 minutes by bike) $$$
-Pickle Barrel Deli (0.7 miles, 4 minutes by bike) $$
-Elm Park Cafe (0.4 miles, 3 minutes by bike) $$
-Garden Fresh Courthouse Cafe (0.8 miles, 5 minutes by bike) $$
-Lucky's Cafe (0.7 miles, 5 minutes by bike) $$
-Bean Counter (0.4 miles, 2 minutes by bike)$$
-Bagel Time (0.3 miles, 2 minutes by bike)$
-Dunkin Donuts (1 minute by bike)$
-Daka (30 seconds by bike)$$$
-Library Cafe (1 minute by bike)$
I love the maps that you chose to include. I know we looked at quite a few of them and these are defiantly the stand out ones that we got inspiration from. I didn't see it at the time but we are defiantly following a trend of simplicity and symbols over words. This reminds me of an earlier reading we did, Pictures-Symbols-Signs where the author discussed the range of abstractness and how you can use more than one form of image to communicate your ideas. I think that is were we have veered off from the examples that you talk about in this post because we are intending to include real images of the food that is featured at each restaurant. I think in our case, with the purpose being to inform and entice our audience to venture off campus to these new and exciting local businesses, the two forms enhances our appeal. I wonder why more of these examples didn't chose to go that route.
ReplyDeleteThis blog post contains an example of exactly what I was trying to say in my comment on a later blog post (the post posted on December 10). Specifically, look at the list that you have made at the end of this blog post of restaurant info you collected. You are using dollar signs to indicate how expensive the restaurant is. More dollar signs is more expensive. Therefore, $ = least expensive and $$$ = most expensive. How do I know this? You haven't explained this system anywhere in your post. This system is well-known and is a shared knowledge among most people in our culture. You could have chosen to use dollar signs like this on your map instead of using three different colors and requiring the viewer to interpret them using the legend.
ReplyDelete